Video Analytics in 2026: How to Improve the Performance of Your Videos
If your business is using web video, analytics should sit at the centre of your content strategy. The right data shows who is watching, how long they stay, and which parts of the video hold attention. When you understand this behaviour, you can make better decisions about scripting, editing, and publishing.
Below is a video I filmed on this topic. The information still holds up, and the examples are useful to understand how viewer behaviour plays out in the real world.
Why Analytics Matter
Once a video is published, the monitoring begins. Analytics answer questions that matter.
- Who watched the video.
- How long they stayed.
- Which sections held attention.
- When viewers dropped off.
- What viewers replayed.
- Whether your call to action appeared at the right moment.
This information helps you refine future content and avoid repeating mistakes. Analytics removes guesswork. It brings clarity to what is working and what needs adjustment in your next video.
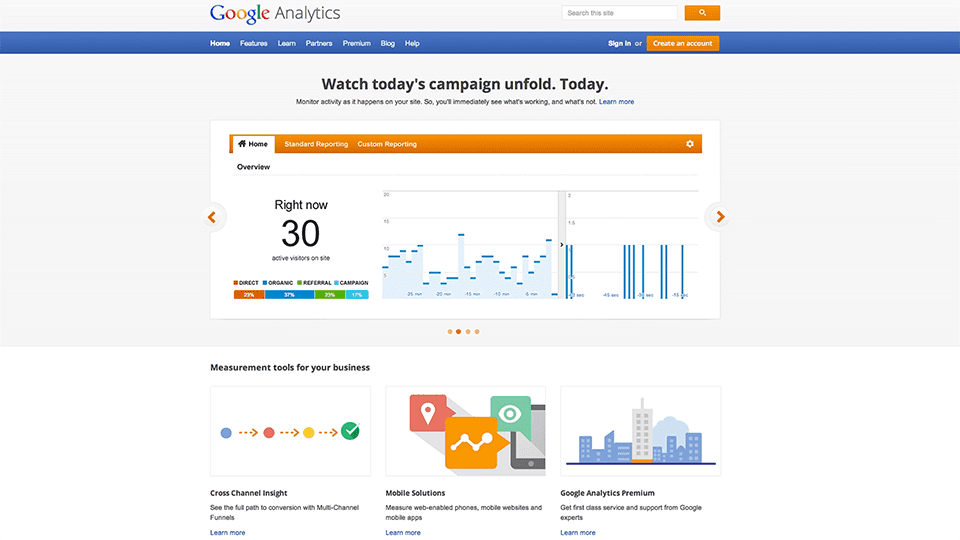
YouTube Analytics
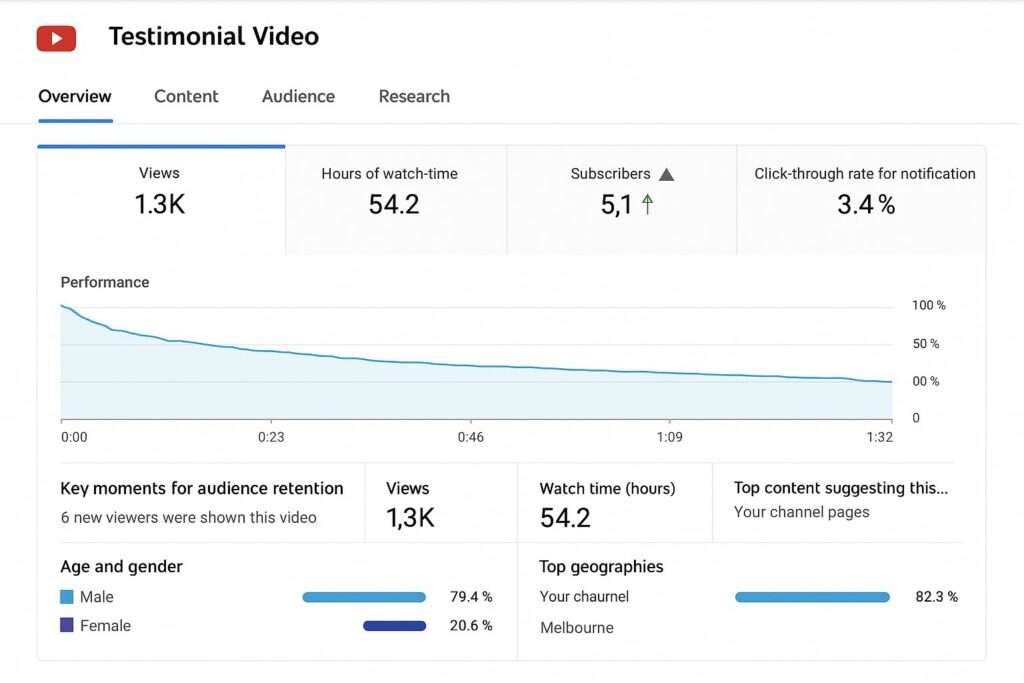
Many businesses share their videos on YouTube, so it is a natural place to start. YouTube Studio provides a clear picture of viewer behaviour. When you open the Analytics tab for a video, you can see:
- Retention over time
- Total minutes watched
- Audience demographics
- Geographic locations
- Traffic sources
- Playback locations
- Key moments that hold or lose attention
These insights begin to build a picture of how your content performs. If you have published a testimonial video or company story, analytics will show how viewers respond to the parts that matter most.
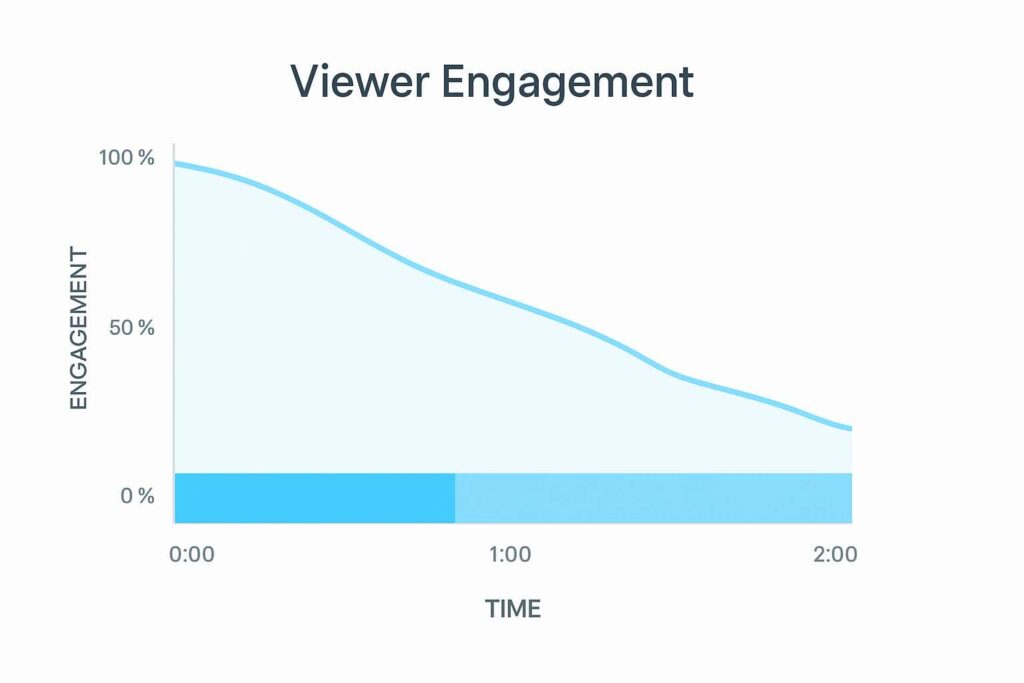
Understanding Retention Graphs
Retention graphs are one of the most useful tools for improving your next production. They show the entire viewer journey. You can see exactly where attention rises, falls, or disappears.
Look for:
- The opening ten seconds.
- Sudden dips in the middle.
- Moments where viewers skip forward.
- Sections that receive replays.
- Where viewers leave.
- Whether your call to action appears too late.
If the introduction is slow, you will see the curve drop early. If the video contains a part that people rewatch, you will see it clearly in the graph. These sections often contain useful information that can inspire future edits or short cut downs.
What Heatmaps Show You
Heatmaps provide a visual way to understand viewer behaviour. Each colour represents how many times a section has been viewed.
- Green signals a single view.
- Yellow, orange, and red show repeated views.
- Red sections indicate strong interest or confusion.
This level of detail helps you pinpoint the parts of a video that matter most. A clear explanation. An interesting moment. A section viewers find valuable enough to revisit.
Turning Analytics Into Better Videos
Analytics matter because they help you make practical improvements to your next production.
- Tighten sections that lose attention.
- Strengthen the hook in the opening seconds.
- Move your call to action earlier.
- Clarify parts that receive replays.
- Build future scripts around high-interest moments.
- Create short clips from key highlights.
- Improve thumbnails and titles for click performance.
- Remove ideas that consistently lose viewers.
This feedback loop is the difference between a one-off video and a long-term strategy. Each piece of content improves the next.
Final Thoughts
Video analytics reveal how real people experience your content. They show you what works, what needs improving, and what viewers find valuable. When you use this information, your videos become more effective and your strategy becomes clearer.
If you want support analysing your current video performance or planning new content, our team can help.
Video Analytics – Frequently Asked Questions
What is video analytics?
Video analytics refers to the measurement of viewer behaviour. This includes retention, drop off points, replays, traffic sources, click performance, and audience demographics.
Which platforms offer the best analytics?
YouTube provides the most detailed free analytics. Vimeo and Wistia offer strong retention and heatmap tracking. Social platforms like LinkedIn and Facebook offer basic engagement data.
How often should I check analytics?
Check analytics within the first forty eight hours for performance trends, then review again after one week. For evergreen videos, a monthly review works well.
What does a steep drop off mean?
A steep drop off often means the opening is too slow or the viewer expected something different. It is a sign to strengthen your hook or adjust your title and thumbnail.
How do heatmaps help improve video quality?
Heatmaps show exactly which parts of a video are rewatched or skipped. This helps you understand where interest peaks and where attention fades.
Can analytics help improve future videos?
Yes. Analytics guide decisions about scripting, editing, pacing, length, and call to action placement. Over time this creates more effective videos.
Ryan Spanger is the founder and managing director of Dream Engine, a Melbourne-based video production company established in 2002. With more than two decades of experience, Ryan has helped leading Australian businesses, government departments, and non-profits communicate their message with clarity and impact through video. He’s known for his strategic approach, reliable process, and commitment to producing videos that deliver measurable results.