Using video analytics to plan your next edit
If your business is using web video, analytics can inform your video marketing strategy. Viewing data can show how people find a video, how much they watch and where they leave. Use it to identify parts of the script, edit or publishing approach worth reviewing.
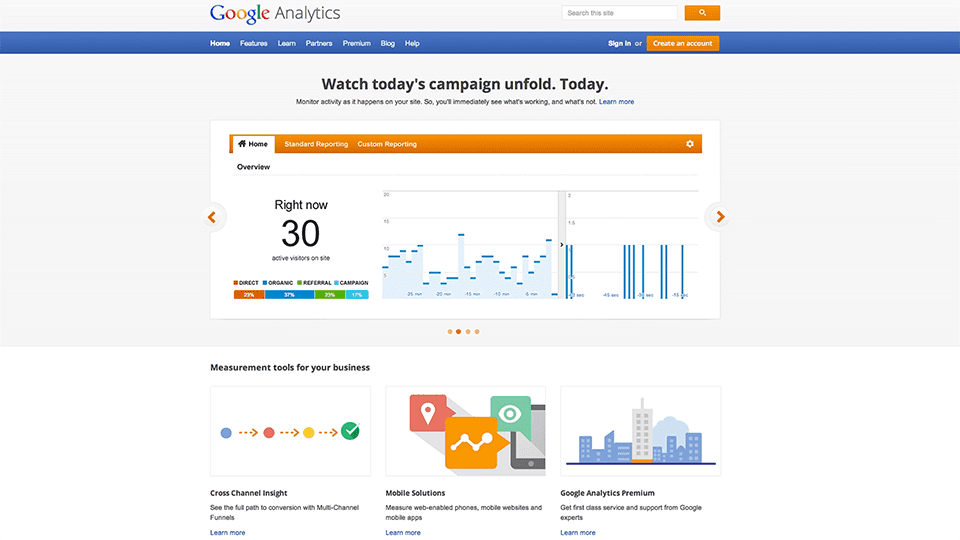
The video below introduces these ideas using examples from an earlier version of the analytics tools. Interfaces and available reports change, so use the current platform guidance alongside it.
What analytics can tell you
The available reports depend on the platform and the amount of viewing data. They can help you review:
- Audience information where available.
- How long they stayed.
- How viewing changed during the video.
- When viewers dropped off.
- What viewers replayed.
- How many viewers reached your call to action.
These reports show viewing behaviour, but they do not explain every viewer’s reason for watching or leaving. Compare them with the video’s purpose, audience feedback and relevant enquiries.
YouTube Analytics
For videos hosted on YouTube, start in YouTube Studio. Depending on the report and the data available, you can review:
- Retention over time
- Total minutes watched
- Audience demographics
- Geographic locations
- Traffic sources
- Playback locations
- Viewing patterns at different points
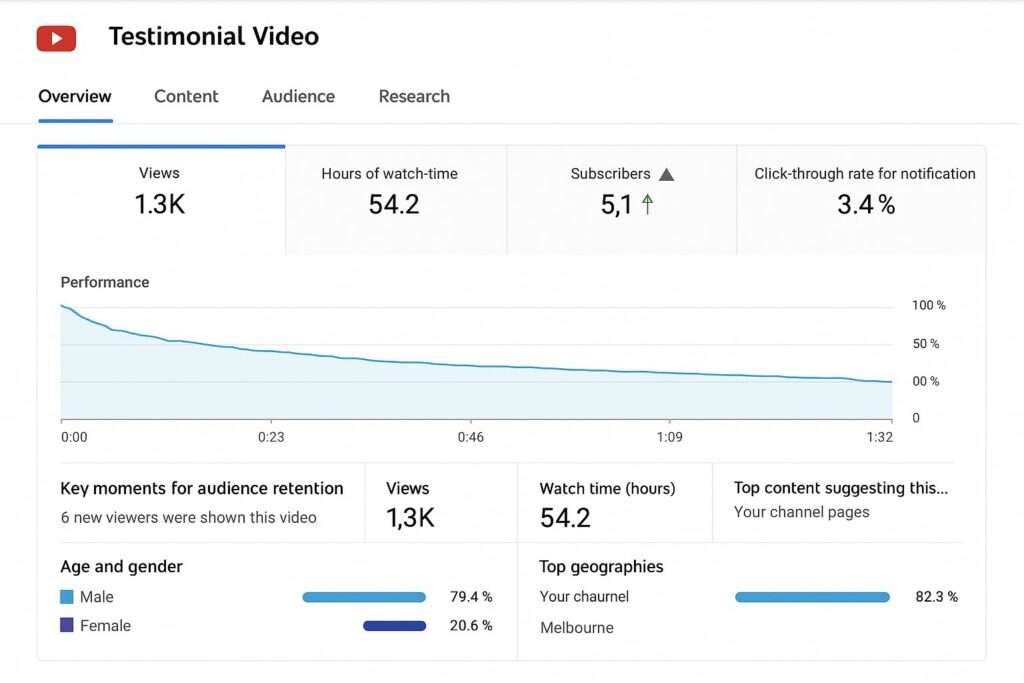
For a testimonial or company story, compare the viewing pattern with the main sections of the edit. Some audience reports may be limited when there is not enough data.
Reading retention graphs
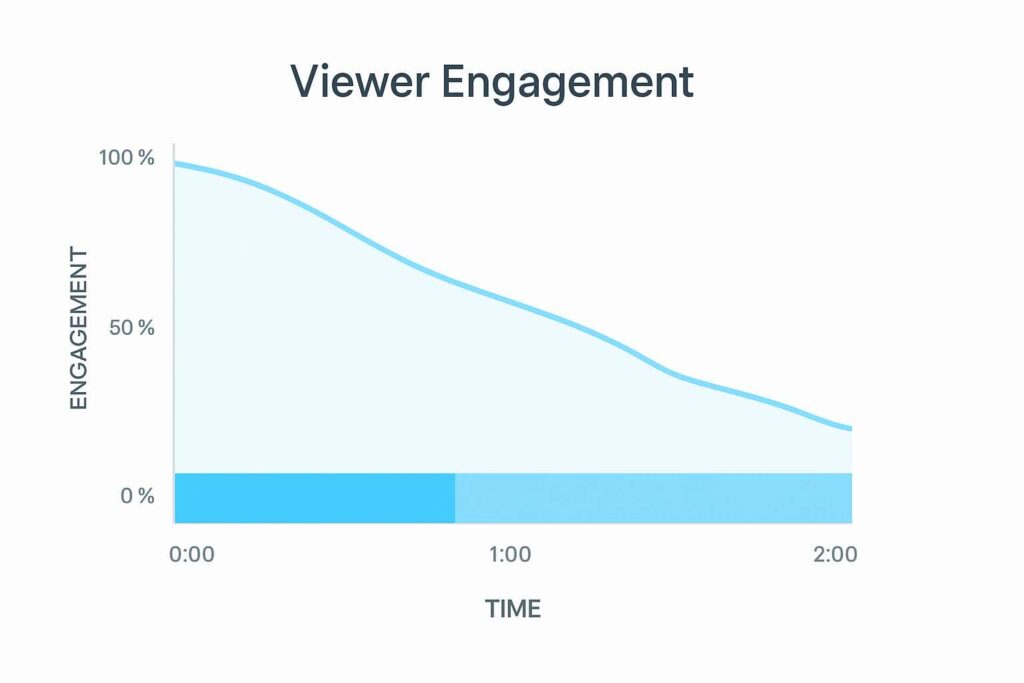
A retention graph shows how viewing changes during the video. It helps you locate sections to review, rather than proving why someone stopped watching.
Look for:
- The opening ten seconds.
- Sudden dips in the middle.
- Moments where viewers skip forward.
- Sections that receive replays.
- Where viewers leave.
- Whether your call to action appears too late.
An early drop may indicate that the opening did not match the title or thumbnail, or took too long to reach the subject. A spike can reflect rewatching or sharing, but can also mean an explanation was difficult to follow. YouTube’s retention guide explains how to read these patterns.
What heatmaps show
Some hosting platforms offer heatmaps for individual viewing sessions. In Wistia’s heatmaps, colours show which sections were played and replayed:
- Green signals a single view.
- Yellow, orange, and red show repeated views.
- White indicates a section that was not played.
A replay tells you that a section was watched again, not why. Watch the passage yourself and consider whether it contains useful detail, an unclear explanation or information someone may need to revisit.
Use the findings to make a specific change
Choose a change that addresses what you found. For example:
- Review sections where many viewers leave.
- Strengthen the hook in the opening seconds.
- Test an earlier call to action if few viewers reach it.
- Check whether replayed sections need a fuller explanation.
- Use audience questions and viewing patterns to plan future scripts.
- Create short clips from key highlights.
- Improve thumbnails and titles for click performance.
- Check whether a section is needed before shortening or removing it.
Where possible, change one element at a time and compare similar audiences and distribution channels. Treat a small number of views cautiously; one or two viewing sessions can distort the pattern.
Review the video against its purpose
Decide what success means before you publish. An instructional video might be useful because people return to a particular step. A service video might help someone prepare an enquiry. Viewing figures alone cannot tell you whether either result occurred.
If you want support analysing your current video performance or planning new content, our team can help.
Video analytics questions
What is video analytics?
Video analytics measures how people find and watch a video. Reports may include viewing duration, retention, replays, traffic sources and audience information. The available data varies by platform.
Which platforms offer the best analytics?
Start with the platform where your audience watches. YouTube Studio provides retention and discovery reports, while some hosting platforms provide individual viewing heatmaps. Check the reports included in your chosen service and plan.
How often should I check analytics?
Review a new video once it has enough views to show a useful pattern, then compare it again after further distribution. For an ongoing series, set a regular review date. Avoid drawing conclusions from a small early sample.
What does a steep drop off mean?
It shows that viewing fell at that point. Check the passage for a slow opening, repetition or a mismatch with the title and thumbnail. The graph alone does not establish the cause.
How do heatmaps help improve video quality?
Heatmaps show which sections were played, replayed or skipped during a viewing session. Use them to choose passages to review, then assess the explanation and context before changing the edit.
Can analytics help improve future videos?
Yes. They can help you decide what to test in a script, edit, title or call to action. Compare the results with the video’s purpose and other feedback before drawing conclusions.
Ryan Spanger is the founder and managing director of Dream Engine, a Melbourne video production company established in 2002. Over the past two decades, he’s produced hundreds of videos for businesses, government departments, universities and healthcare organisations across Australia. Ryan specialises in helping organisations explain complex ideas through clear, engaging video content, with particular experience in corporate communications, training and education.